
Mingzhi Cai, a distinguished product experience designer based in New York City, is redefining the fintech sector with her innovative approach to data visualization. Working at one of the fintech giants, she tackles the complex task of simplifying financial data for end users, aiming to create an intuitive narrative and minimize cognitive overload. Recognizing the repetitive nature of creating data visualizations and dashboards, Mingzhi embarked on developing a comprehensive data visualization library. This initiative was not just a solution for her daily challenges but also a generous contribution to the broader design community.
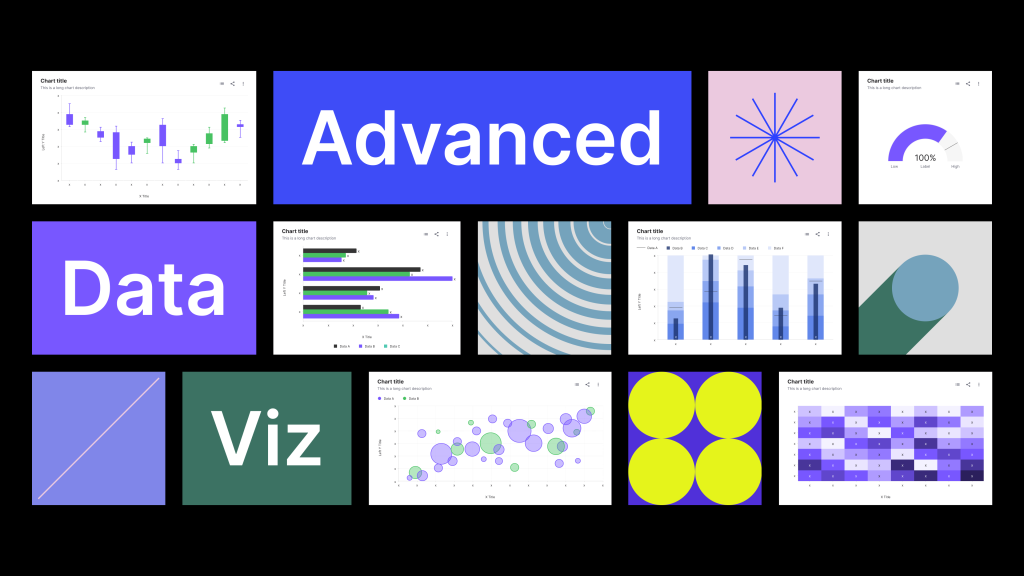
Her project, Advanced Data Visualization, transcends traditional chart libraries available in Figma. It stands as a pioneering tool that empowers designers to effortlessly construct dashboards, enabling them to make confident design decisions. It offers an extensive range of customizable chart types, and allows for detailed customization, offering a balance of aesthetic appeal and functionality.

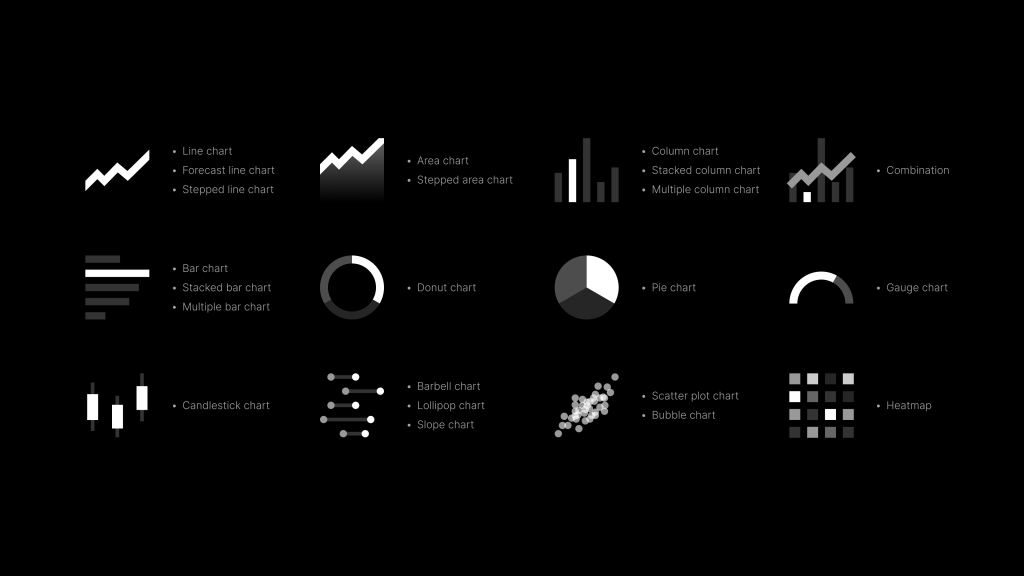
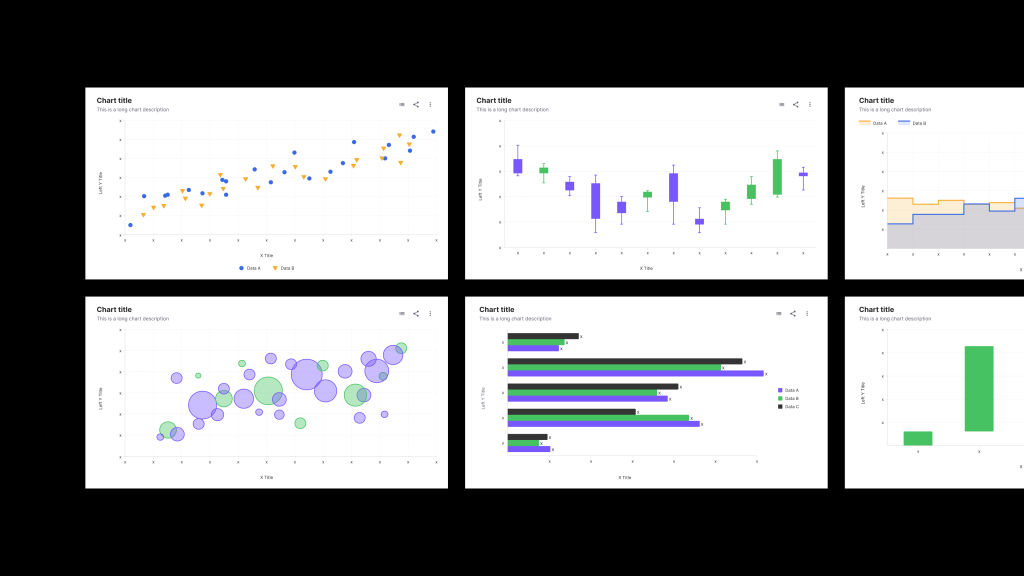
During the project’s conception, Mingzhi conducted an extensive analysis of existing chart libraries, front-end components and chart guidelines. Her goal was to create a tool that combined the best of existing systems while introducing innovative enhancements. Leveraging her expertise in interface design and proficiency in Figma, Mingzhi crafted a library where each element within a chart is easily adjustable, transforming static charts into dynamic storytelling tools.
Central to this innovative tool are its adaptive color palettes and flexible elements, which marry design consistency with user-friendly features. Mingzhi devoted months to researching color usage, culminating in a palette that not only offers a broad spectrum of hues but also caters to users with color vision deficiencies. It provides various shades of each hue for designers to enhance visual contrast. Her dedication to accessibility and clarity in data storytelling underscores her commitment to making data more approachable for a diverse audience, thereby promoting information transparency.

The Advanced Data Visualization library’s primary mission is to make data design more friendly, enhancing the designer-data interaction. Hosted on the renowned UX design platform Figma, the library reflects Mingzhi’s dedication to user-centric design and ongoing improvement, fueled by direct feedback from the design community. This approach has led to thousands of downloads and high user satisfaction, evidencing its effectiveness and appeal. The library’s recognition at the prestigious international A’ Design Award further cements Mingzhi’s status in the creative industry.
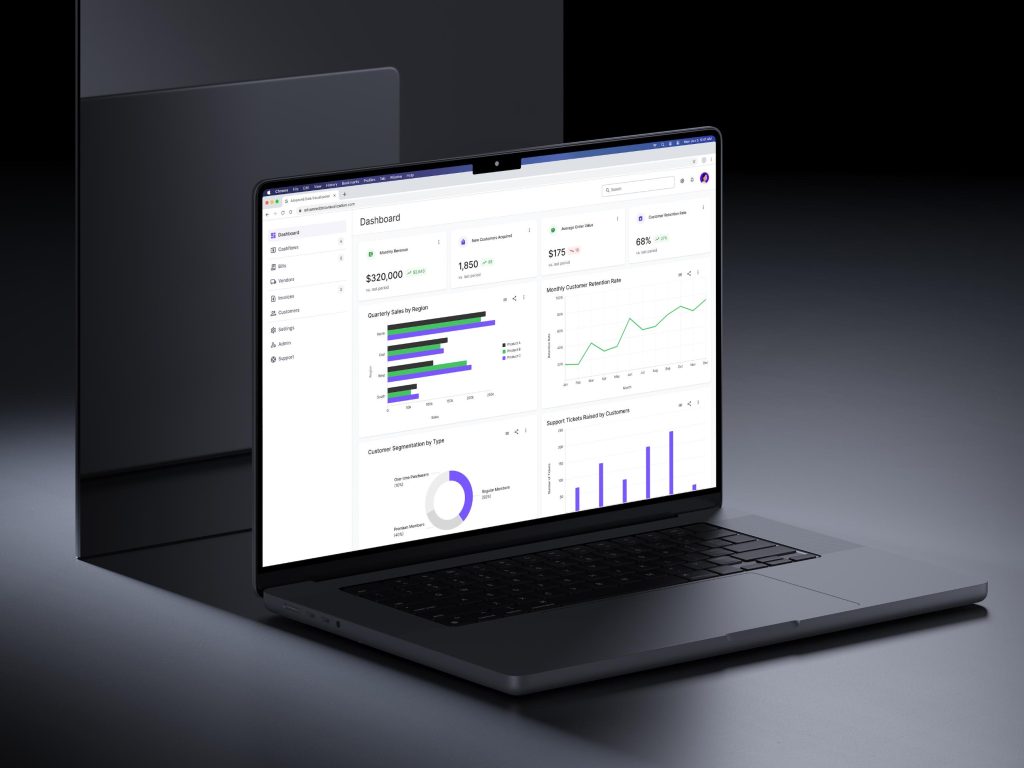
At its heart, the Advanced Data Visualization library is intuitive and user-centric, seamlessly fitting into a designer’s workflow. Mingzhi’s commitment to continual development ensures the library stays relevant, adapting to the evolving challenges of data storytelling. Ultimately, her work represents a significant leap in democratizing data, making it more accessible and engaging for designers and audiences alike. In summary, the Advanced Data Visualization library is not just a tool; it’s a movement toward more inclusive, engaging, and empowering design.
Visit Advanced Data Visualization: https://www.figma.com/community/file/1258847030939461287/advanced-data-visualization


